type
status
date
slug
summary
tags
category
icon
password
Background
The idea of a “visual prothesis” is not as far fetched as it might seem at first, and a large number of research groups are working on different approaches. A recent overview can be found in Retinal Prothesis (Bloch, 2019). The exercise description part was created by Prof. Dr. Thomas Haslwanter.
Exercise Description: Simulation of a Retinal/Visual Implant
Data
All the Files for this exercise are bundled in “Ex_Visual.zip”
In addition, you can use the following files:
- Typical standard test images that are often used in image processing (e.g. lena, mandrill, etc.) can also be found at the Waterloo BragZone.
- You can also use one of the following:
- Hans van Hateren hosts a website with natural images that people often use for training receptive fields, etc.
General Requirements
For this exercise you should design a "visual prosthesis": Write a Pyhon program which
- Takes a given input image, or - if none is provided - lets you interactively select an input image
- In this image, lets you interactively select a fixation point ("ginput")
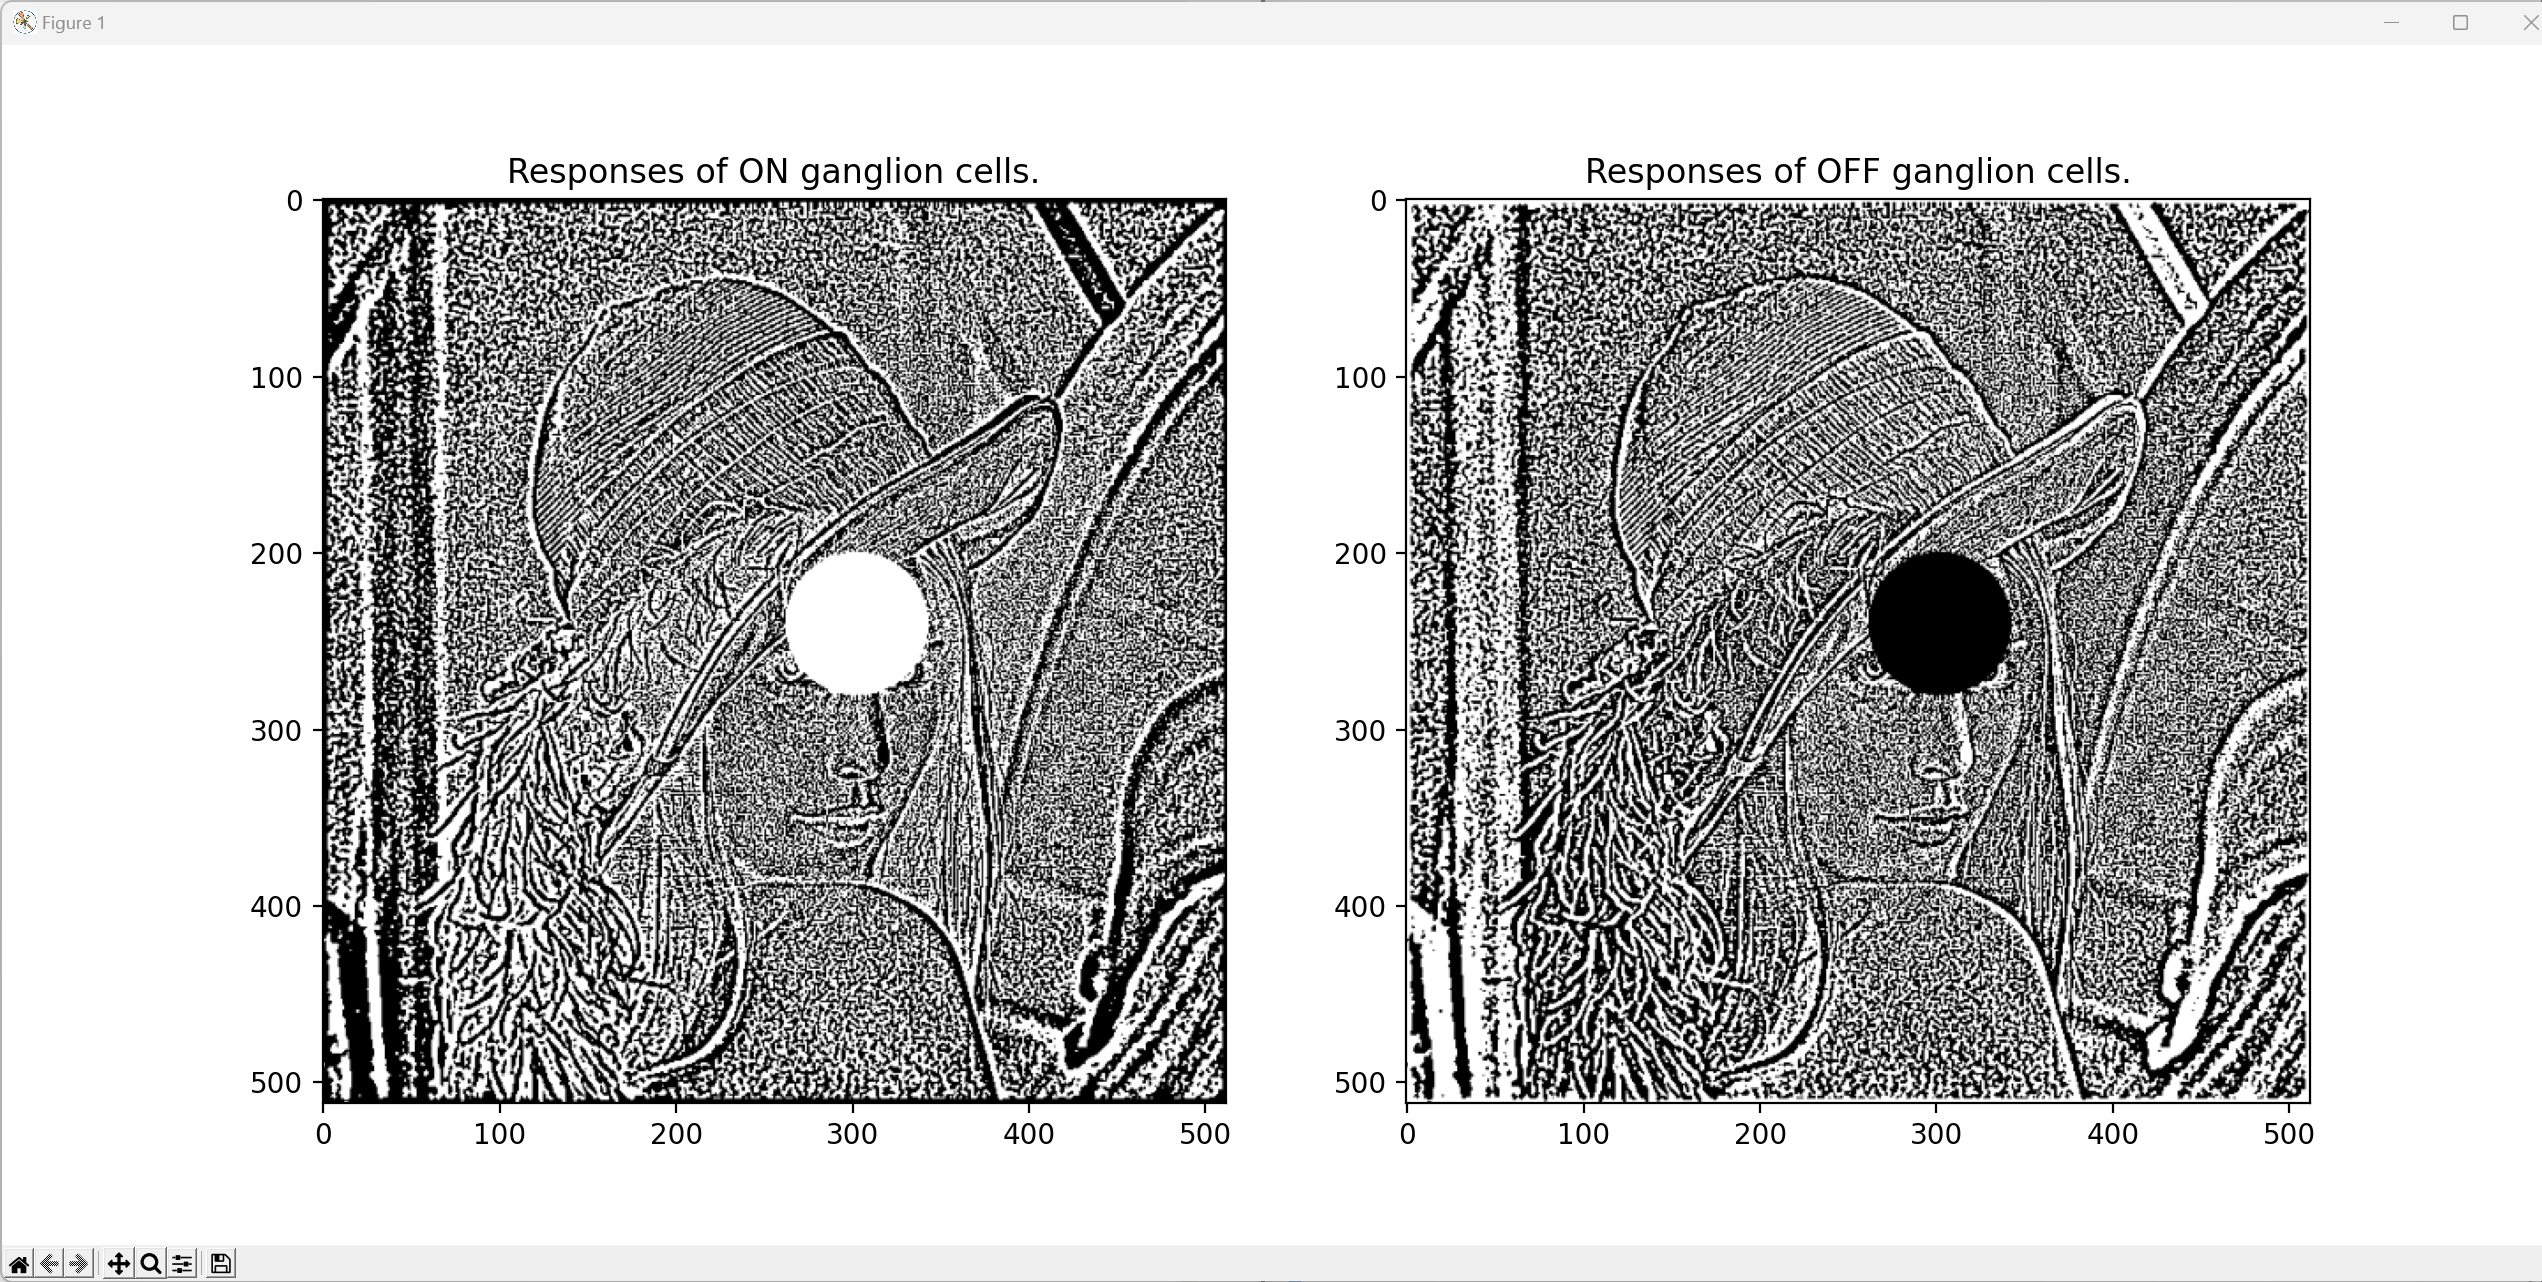
- Calculates the activity in the retinal ganglion cells, and shows the corresponding activity, and
- Calculates and shows the activity in the primary visual cortex, and
- Save the images to an out-file.
Retinal Ganglion Cells
- Assume that
- the display has a resolution (for those 30 cm) of 1400 pixels,
- and is viewed at a distance of 60 centimeter (see Figure below),
- and that the radius of the eye is typically 1.25 cm.
This lets you convert pixel location to retinal location.
- We know that the retinal ganglion cells respond best to a "center-surround" stimulus: they show the maximum response when the center is bright and the surrounding dark ("center-on cells"), or vice versa ("center-off cells"). This behavior can be simulated with a "Difference of Gaussians" (DOG)-filter. For this exercise, simulate only "center-on" responses. The figure below shows a section through the receptive field of a typical ganglion cell. The receptive field of such a cell can be simulated with a "difference-of-Gaussians" (DOG)-filter with the following ratio for the standard deviations of the two Gaussians:
From the figure below we see that the sidelength of the receptive field should be about
so that the response can go back approximately to zero at the edges (which happens at about ).
- The receptive field size increases approximately linearly with distance from the fovea. For this exercise we simulate only magnocellular cells, the receptive field of which have a receptive field size of approximately
The parameters are also described in the wikibook on Sensory Systems, and in the article Computational models of early human vision, which contains the following image for M- and P-cells:
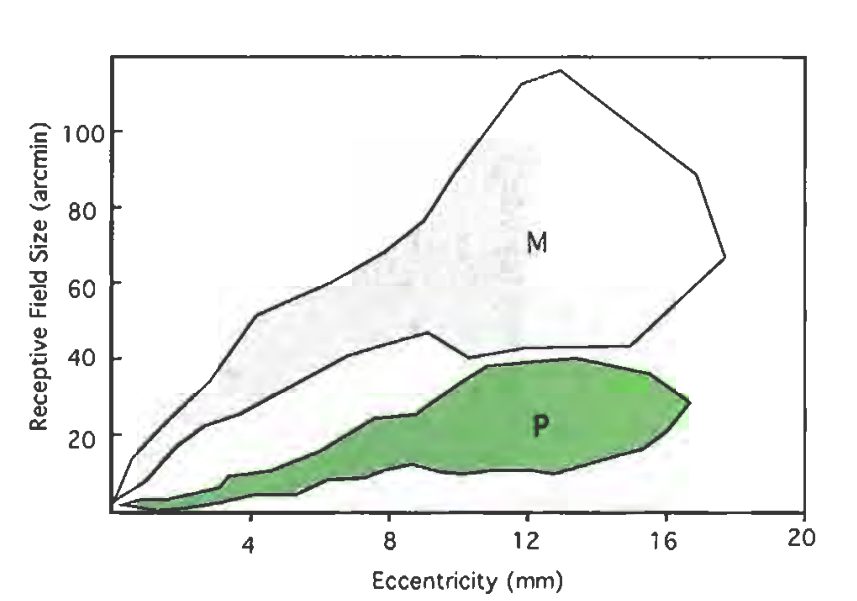
Note:Take this parameter as approximation: I have found different values in the literature, regarding "size of receptive field", "size of dendritic field", "center size", "visual acuity", etc, and their exact relation to each other.
- To implement the simulation of the retinal representation of the image, proceed as follows:
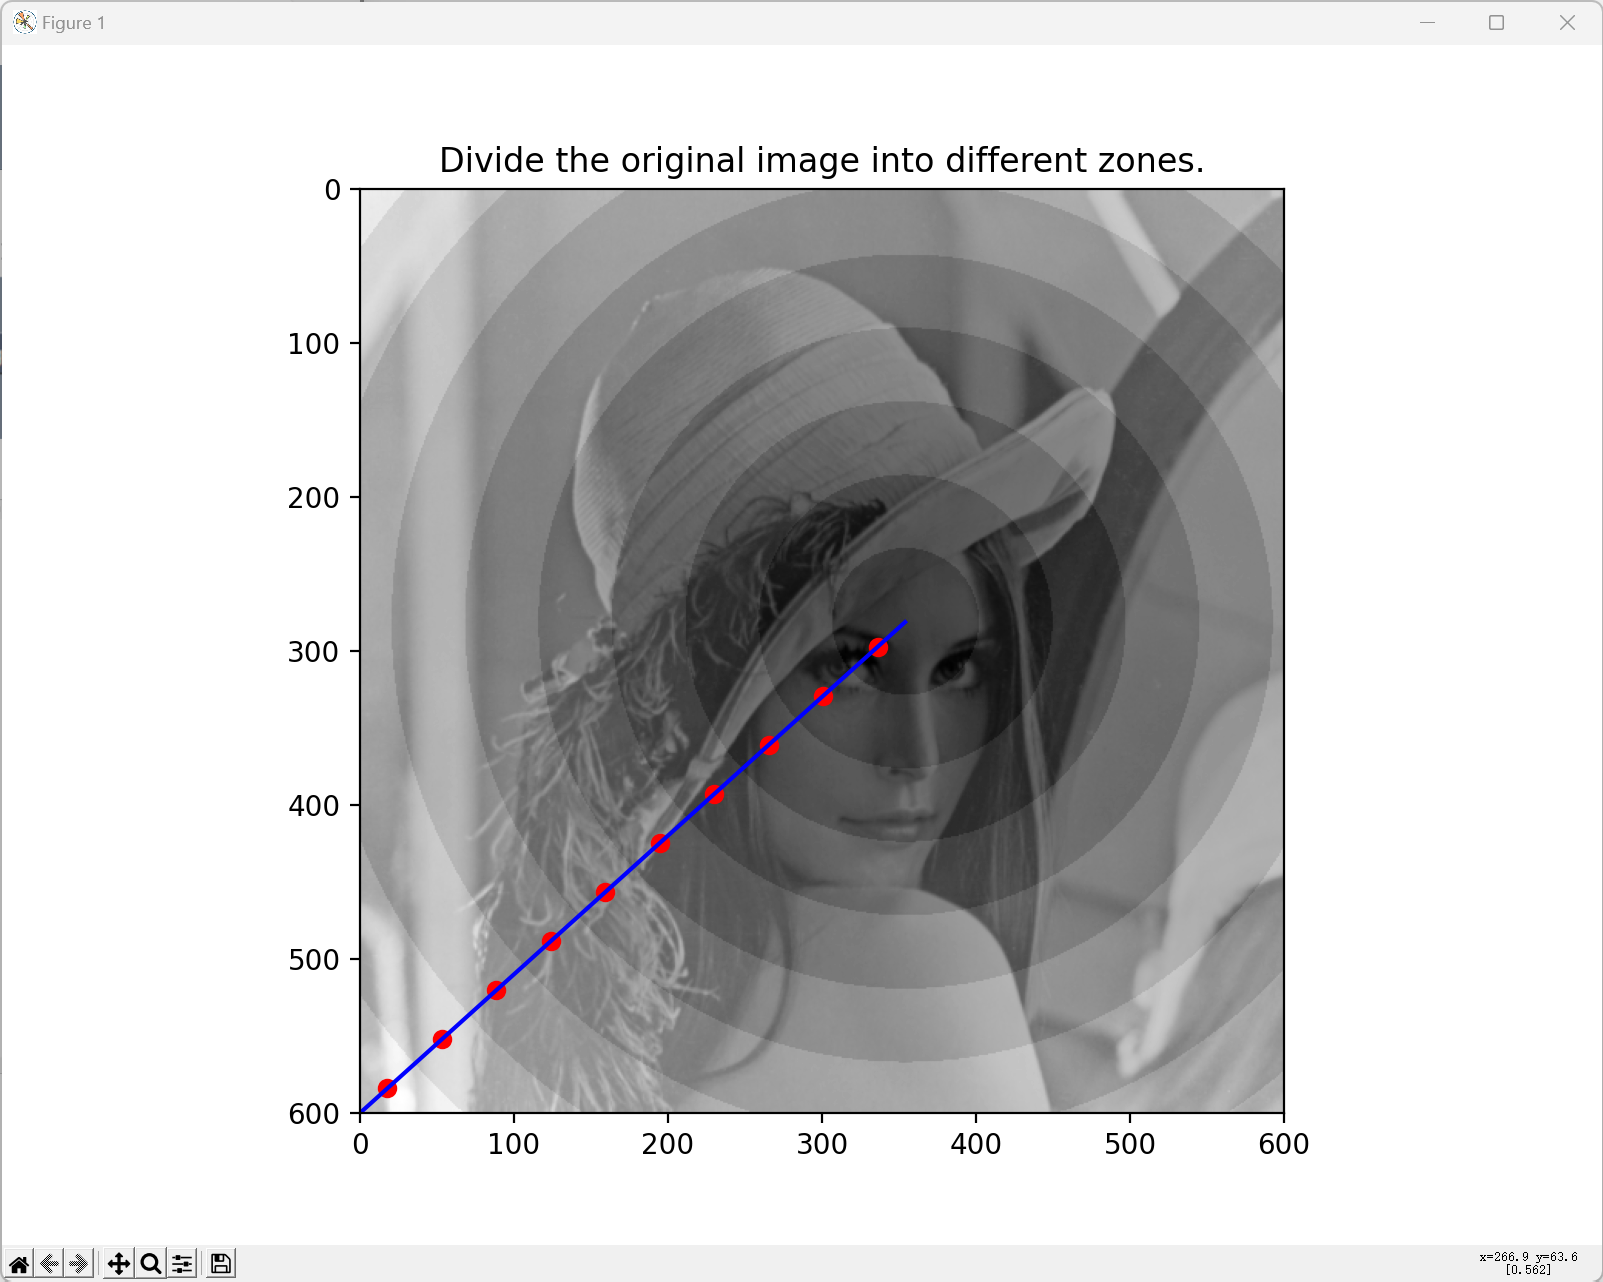
From the selected fixation point, find the largest distance to one of the four corners of the image. Break this distance down into 10 intervals. Using those intervals, create 10 corresponding radial zones around the fixation point. For each zone, we want to find the corresponding filter: we can do so by taking the mean radius for each zone [in pixel]. From this we can find the corresponding eccentricity on the fovea [in mm], using the geometry from the figure above. This eccentricity leads to the size of the receptive field [in arcmin], which in turn can be converted into pixel, again using the geometry shown above. Selecting the next largest odd number create a symmetric filter with that side-length, and choose the filter coefficients such that they represent the corresponding DOG-filter.
Cells in V1
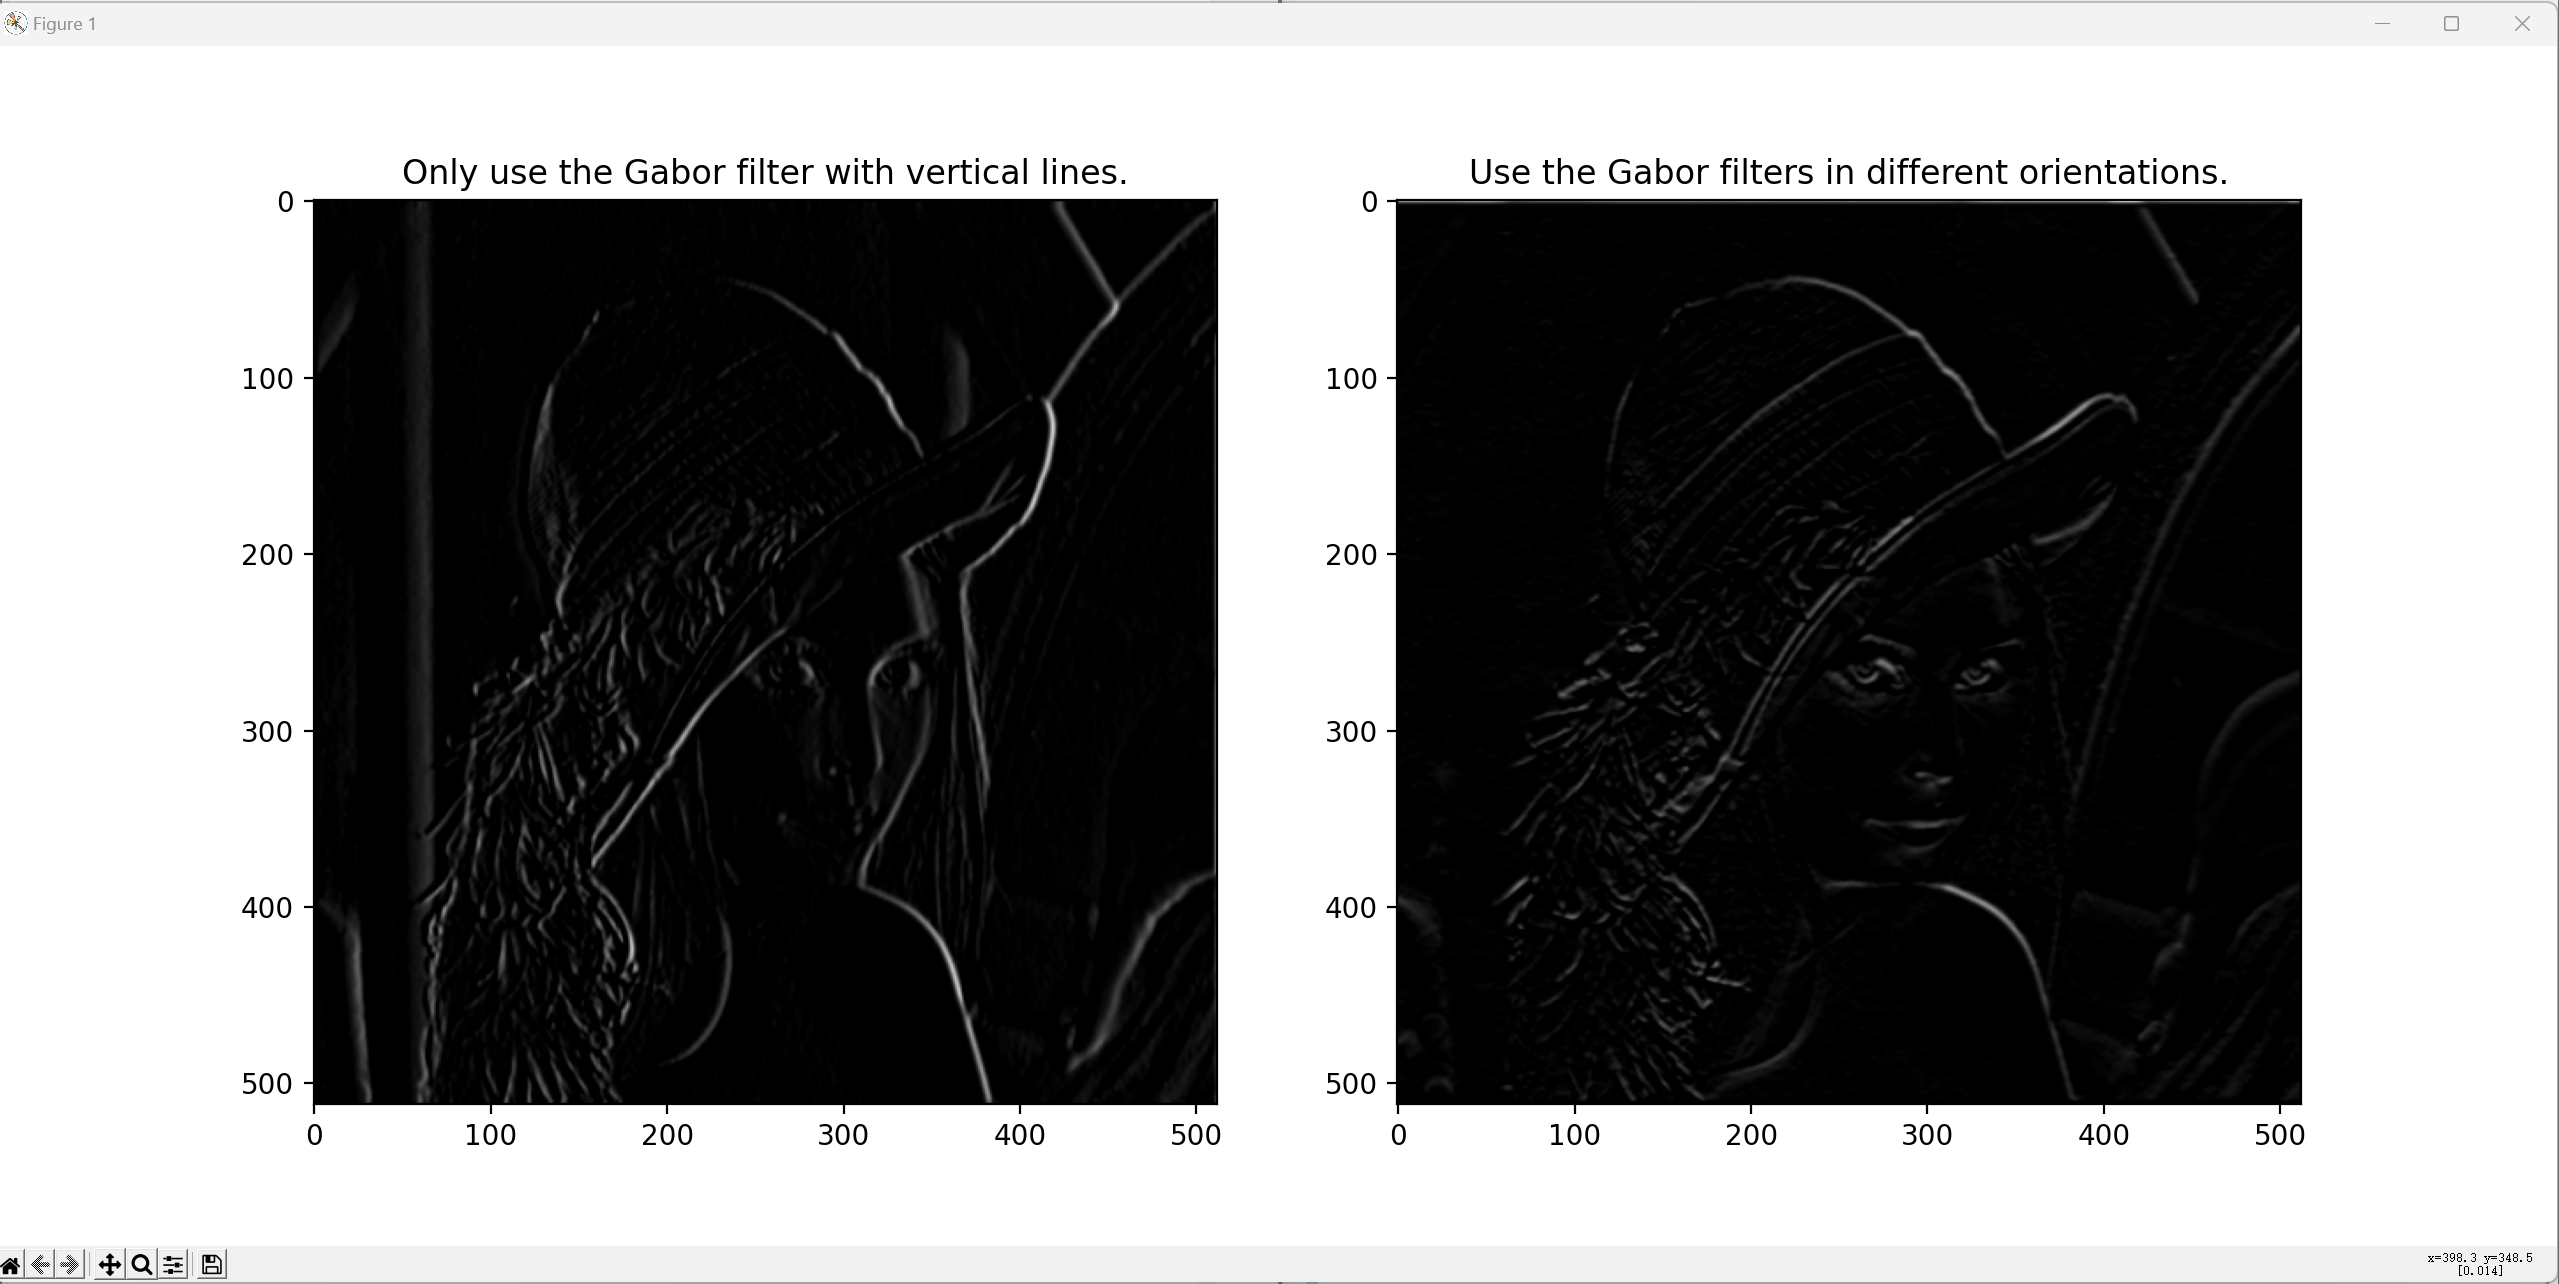
- Activity in V1 can be simulated by Gabor filters with different orientations. For this exercise, first only use Gabor filters which respond to vertical lines.
- Since I have not been able to find explicit information about any dependence of receptive field size on distance from fovea, please assume a constant receptive field size.
- Input is the original image, not the input from the ganglion cells! This is due to the definition of "receptive field".
- Find paramters for this vertical Gabor-filter that lead to sensible results, as assessed by visual inspection of the resulting image.
- When this works, repeat this for the activity of Gabor cells with a few different orientations (0 - 30 - 60 - 90 - 120 - 150 deg), to get a "combined image" in V1.
Tips
Python
- gabor_demo.py uses OpenCV to give a nice interactive example of how the output of different cells in V1 corresponds to different features of the image.
- Don't forget to check out the IPYNB notebooks on image processing, which should provide a good introduction to image processing with Python.
Interesting Links
General comments
- Name the main file
Ex3_Visual.py.
- For submission of the exercises, please put all the required code-files that you have written, as well as the input- & data-files that are required by your program, into one archive file. ("zip", "rar", or "7z".) Only submit that one archive-file. Name the archive
Ex3_[Submitters_LastNames].[zip/rar/7z].
- Please write your programs in such a way that they run, without modifications, in the folder where they are extracted to from the archive. (In other words, please write them such that I don't have to modify them to make them run on my computer.) Provide the exact command that is required to run the program in the comment.
- Please comment your programs properly: write a program header; use intelligible variable names; provide comments on what the program is supposed to be doing; give the date, version number, and name(s) of the programmer(s).
- To submit the file, go to "Ex 3: Self-Grading".
Implementation
The whole procedure can be divided into two tasks: Task 1 and Task 2.
Read in the data
Before implementing the simulations of task 1 and task 2, we need to read in the pre-defined parameters and select the input image. The process is implemented using Python GUIs.
# Load the pre-defined parameters.
dir_crt = os.getcwd()
Params = utils.Params_visual(path_options=os.path.join(dir_crt, 'options.yaml'))

# GUI.
Params = utils.gui_params(Params=Params)

# Select the input image.
layout = [[PSG.Text('Select the original image (Browse or type in directly).')],
          [PSG.InputText(), PSG.FileBrowse('Select Image')],
          [PSG.OK(), PSG.Cancel()]]
window = PSG.Window('Select the input', layout=layout, keep_on_top=True)

while True:
    event, values = window.read()
    if event in (None, 'OK'):
        # User hit the OK button.
        break
    elif event in (None, 'Cancel'):
        # User hit the cancel button.
        sys.exit()
    print(f'Event: {event}')
    print(str(values))

window.close()
img_input = plt.imread(fname=values['Select Image'])
if len(img_input.shape) == 3:  #  Color image
    img_input = rgb2gray(img_input)
Params.size_img_ori = np.flip(np.array(img_input.shape))
img_input = cv2.resize(img_input, dsize=tuple(Params.size_img_default), interpolation=cv2.INTER_LINEAR)
In the experiment, we used the Lena image (Figure 3) as the input.
Task 1
In task 1, we simulate the activity in the retinal ganglion cells. The whole process is :
- Calculate the largest distance from the fixation point to the four corners.
- Divide the distance into several intervals and create circular zones.
- Determine one DoG filter for each circular zone separately.
- Apply the DoG filters to the input image.
We implemented the code using a separate function. The code is:
def fun_task_1(img_input, Params):
    """Task-1 in Exercise-3.
    Task-1 is about the simulation of the activity in the retinal ganglion cells.
    The whole process is:

    Parameters
    ----------
    img_input: The input image in grayscale. Numpy array.
    Params: A class containing the pre-defined parameters.

    Returns
    -------
    response_ON: Response reaction of ON ganglion cells.
    response_OFF: Response reaction of OFF ganglion cells.
    """

    # Visualization of the input image.
    fig, ax = plt.subplots(dpi=200, figsize=(8, 6))
    plt.imshow(
        X=cv2.resize(src=img_input, dsize=tuple(Params.size_img_ori) ,interpolation=cv2.INTER_LINEAR),
        cmap='gray'
        )  #  Display in grayscale.
    plt.title(label='The original image.')
    fig.canvas.mpl_connect('button_press_event', onclick)
    plt.show()

    # Return the fixation coordinates.
    dir_crt = os.getcwd()
    coords_fixation = np.load(os.path.join(dir_crt, 'coords_tmp.npy'), allow_pickle=True)
    # Resize
    coords_fixation[0] = coords_fixation[0]*Params.size_img_default[0]/Params.size_img_ori[0]
    coords_fixation[1] = coords_fixation[1]*Params.size_img_default[1]/Params.size_img_ori[1]

    # Calculate the farthest distance to the corner and divide the distance into several intervals.
    coords_interval, zones = coord2interval(
        coords_fixation=coords_fixation,
        img_input=img_input,
        Params=Params
        )

    # Apply the appropriate DoG filter to each level.
    img_output = np.empty_like(img_input)
    for i_zone in range(1, Params.num_interval + 1):
        # Calculate the distance between the fixation point and the interval mid-point.
        dist_tmp = np.linalg.norm(coords_fixation - coords_interval[i_zone-1, :])
        # Apply the DoG filter.
        filter_DoG = get_DoG_filter(img=img_input, dist_pix=dist_tmp, Params=Params)
        img_tmp = signal.convolve2d(in1=img_input, in2=filter_DoG, mode='same')
        idx = (zones == i_zone)
        img_output[idx] = img_tmp[idx]

    # Simulate the ON-OFF reaction.
    # ON cells.
    response_ON = np.empty_like(img_output)
    response_ON[img_output > Params.t_ganglion_ON] = 1
    response_ON[img_output <= Params.t_ganglion_ON] = 0
    # OFF cells.
    response_OFF = np.empty_like(img_output)
    response_OFF[img_output > Params.t_ganglion_OFF] = 0
    response_OFF[img_output <= Params.t_ganglion_OFF] = 1

    # Resize to the original scale.
    response_ON = cv2.resize(src=response_ON, dsize=tuple(Params.size_img_ori), interpolation=cv2.INTER_LINEAR)
    response_OFF = cv2.resize(src=response_OFF, dsize=tuple(Params.size_img_ori), interpolation=cv2.INTER_LINEAR)

    # Visualization of the ON-OFF reaction.
    fig, ax = plt.subplots(dpi=200, figsize=(16, 6))
    plt.subplot(1, 2, 1)
    plt.imshow(X=response_ON, cmap='gray')  #  Display in grayscale.
    plt.title(label='Responses of ON ganglion cells.')
    plt.subplot(1, 2, 2)
    plt.imshow(X=response_OFF, cmap='gray')
    plt.title(label='Responses of OFF ganglion cells.')
    fig.canvas.mpl_connect('button_press_event', onclick)
    plt.show()

    return response_ON, response_OFF
Task 2
In task 2, we simulate the activities in V1. The whole process is:
- Calculate the Gabor filters of different orientations.
- Apply them to the input image separately.
- Combine the results and take the average.
The function of task 2:
def fun_task_2(img_input, Params):
    """Task-2 in Exercise-3.
    Task-2 is about the simulation of the activities in V1.

    Parameters
    ----------
    img_input: The input image in grayscale. Numpy array.
    Params: A class containing the pre-defined parameters.

    Returns
    -------
    img_output: The output image in grayscale. Numpy array.
    """

    # First, only use Gabor filters which correspond to vertical lines.
    filter_gabor_vertical = get_Gabor_filter(theta=180, Params=Params)
    img_vertical = signal.convolve2d(in1=img_input, in2=filter_gabor_vertical, mode='same')
    img_vertical[img_vertical<0] = 0

    # Then, try different orientations for Gabor filters.
    thetas = np.arange(0, 181, 30)
    img_output = np.empty(shape=(img_input.shape[0], img_input.shape[1], len(thetas)))
    for i_theta in range(len(thetas)):
        filter_gabor_tmp = get_Gabor_filter(theta=thetas[i_theta], Params=Params)
        img_output[:, :, i_theta] = signal.convolve2d(in1=img_input, in2=filter_gabor_tmp, mode='same')
    img_output = np.mean(a=img_output, axis=2)
    img_output[img_output<0] = 0

    # Resize to the original scale.
    img_vertical = cv2.resize(src=img_vertical, dsize=tuple(Params.size_img_ori), interpolation=cv2.INTER_LINEAR)
    img_output = cv2.resize(src=img_output, dsize=tuple(Params.size_img_ori), interpolation=cv2.INTER_LINEAR)

    # Visualization of the output image.
    fig, ax = plt.subplots(dpi=200, figsize=(16, 6))
    plt.subplot(1, 2, 1)
    plt.imshow(X=img_vertical, cmap='gray')  #  Display in grayscale.
    plt.title(label='Only use the Gabor filter with vertical lines.')
    plt.subplot(1, 2, 2)
    plt.imshow(X=img_output, cmap='gray')
    plt.title(label='Use the Gabor filters in different orientations.')
    fig.canvas.mpl_connect('button_press_event', onclick)
    plt.show()

    return img_output
Example
Here we present an example of the whole process of simulations. The original input image is Figure 3.
Pre-defined parameter setting:
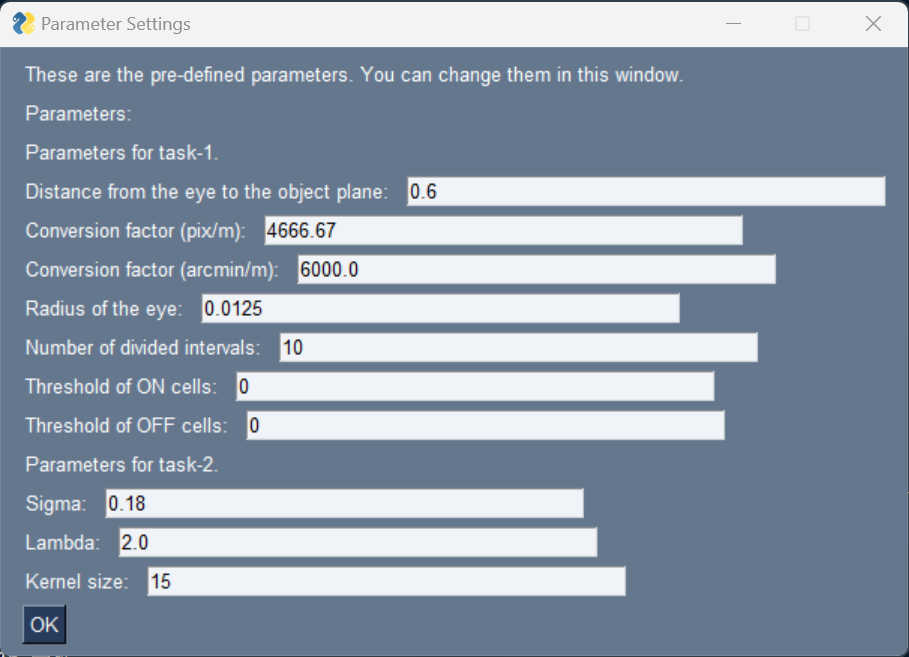
Select image:

The input image (grayscale):
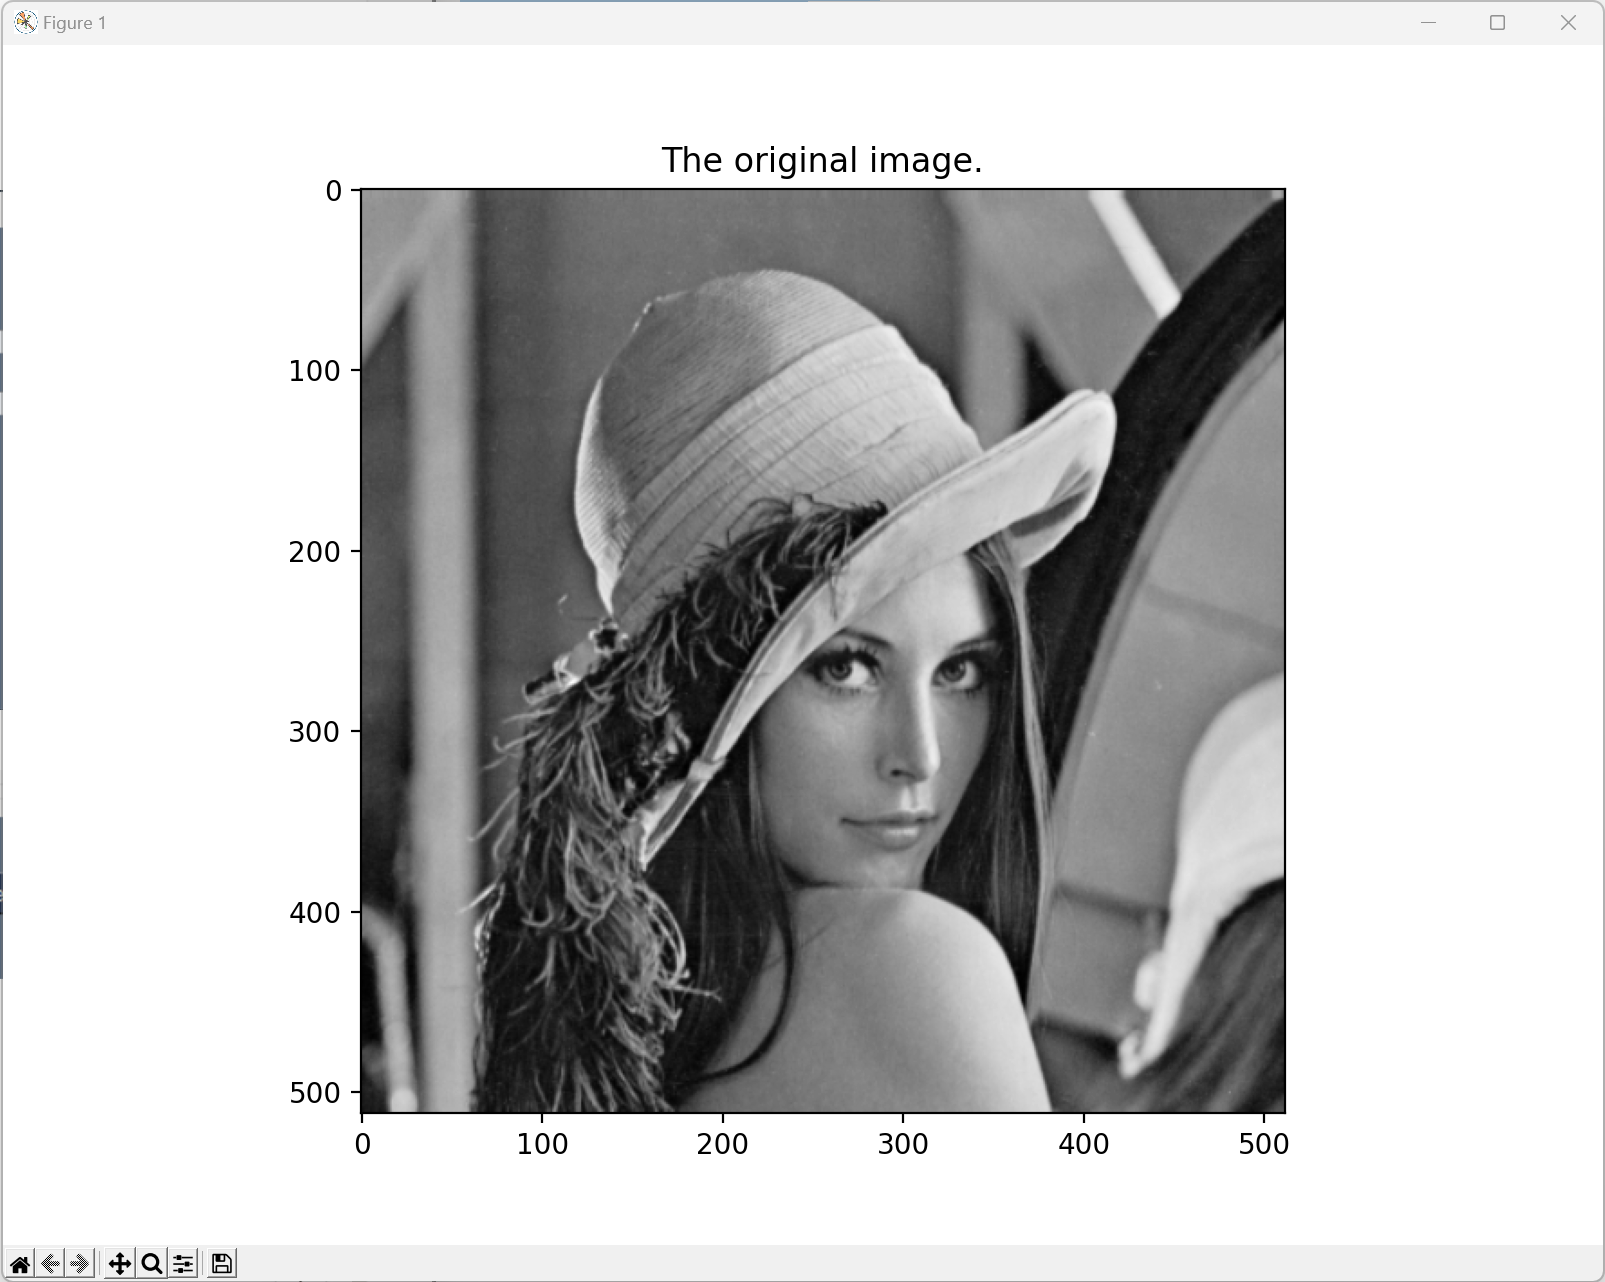
Task 1
Circular zone division:
Responses of ganglion cells after applying DoG filters:
Task 2
Simulation results of V1 activities:
- 作者:Shuo Li
- 链接:https://shuoli199909.com/article/eth-cs-ex3
- 声明:本文采用 CC BY-NC-SA 4.0 许可协议,转载请注明出处。

